| KEY TAKEAWAYS
• Published yield data treats yield as a range, not a constant: FAO’s compilation for Alaska pollock reports skinless fillet yields across fifty fish ranging from 30.7% to 43.3%, and its own introduction warns that most published yields come from a handful of fish caught on one occasion. • A peer-reviewed study that tracked 60 individual salmon through filleting found roughly 50% of gutted weight ended up as sold fillet, with 23.3% average weight loss at filleting alone — and built a model that predicts a batch’s yield from raw-material measurements before it is ordered. • Yield numbers are only comparable on the same basis. Round, gutted, headed-and-gutted, skin-on and skinless are different denominators; Seafish notes skinless portions run roughly 10 percentage points lower than skin-on. • In shrimp, the head alone is about 37% of whole weight, and a feasibility study estimated processor profit margins in the range of 1–2% — a yield swing of two points is larger than the whole margin. • The transformation records FSMA 204 already requires include the quantity and unit of measure of both input and output lots. If you capture them, yield by lot is arithmetic you already own. |
Yield Is a Distribution, Not a Constant
Ask three people in a seafood plant what the yield is on a given product and you will usually get one number, carried from a spec sheet into a costing model and left there for years. The published data does not support that confidence.
FAO’s reference compilation of yields for commercially important species is blunt about it. Its authors note that a high proportion of the individual yield measurements in the literature come from a small number of fish — “sometimes only one, caught on a single occasion” — and that the effects of catch date, location, fish size and natural variability have seldom been taken into account. Yield measurements, they write, are “particularly variable.”[1]
The species tables show what that means in practice. For Alaska pollock, one study of fifty fish reported skinless fillet yield of 35.5% with a standard deviation of 2.6 and a range of 30.7% to 43.3%; another source on the same species reported 41.7% using a deboning machine on a double pass. FAO’s own selected value is 36%.[2] Alaska Sea Grant’s recovery tables cover more than 65 species of Pacific fish and shellfish and give average percent recovery from starting material to end product — and give ranges, because averages alone would mislead.[3]
None of this is a reason to distrust yield. It is a reason to measure your own.
Get the Basis Right Before You Get the Number Right
Most arguments about yield are not arguments about yield. They are arguments about the denominator.
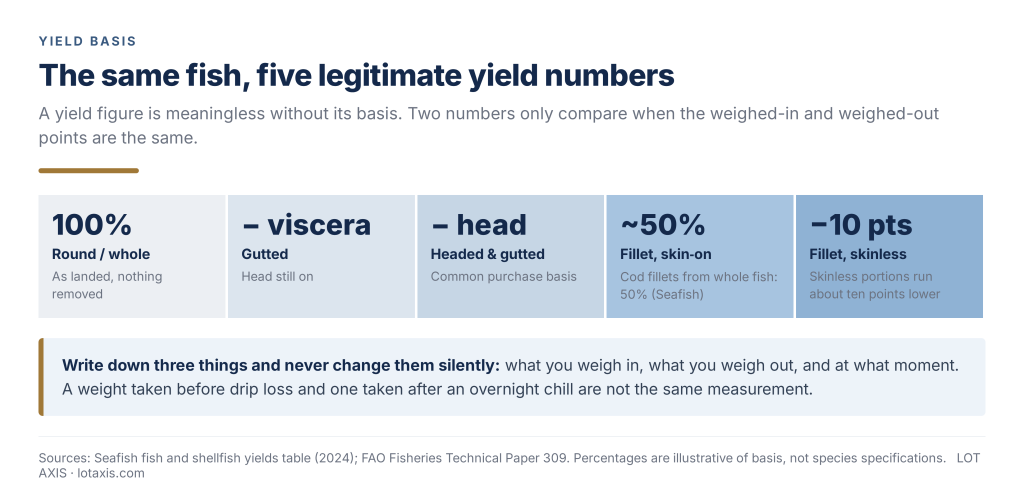
Round weight, gutted, headed and gutted, fillet skin-on, fillet skinless, portioned, cooked — each is a legitimate basis, and a number quoted on one basis says nothing about a number quoted on another. Seafish’s yield tables illustrate the point cleanly: cod fillets are listed at 50% from whole fish, cod suprêmes at 30%, monkfish skinless fillets at 21%, and a general note that skinless portions reduce the yield by roughly ten percentage points against skin-on.[4] In shrimp, the head alone is about 37% of whole shrimp weight, with legs and shell another 11–13%; meat yields from whole shrimp are commonly cited in a 20–40% band depending on size, condition and machinery.[5]
So before the first weight goes into a spreadsheet, write down three things and never change them silently: what you are weighing in, what you are weighing out, and at what moment. A yield taken before drip loss and a yield taken after an overnight chill are not the same measurement.
Averages Hide the Money
Here is the part that matters commercially. When yield is a plant-level average, every lot is charged the plant’s average cost, and the lots that destroyed margin are subsidised by the ones that made it.
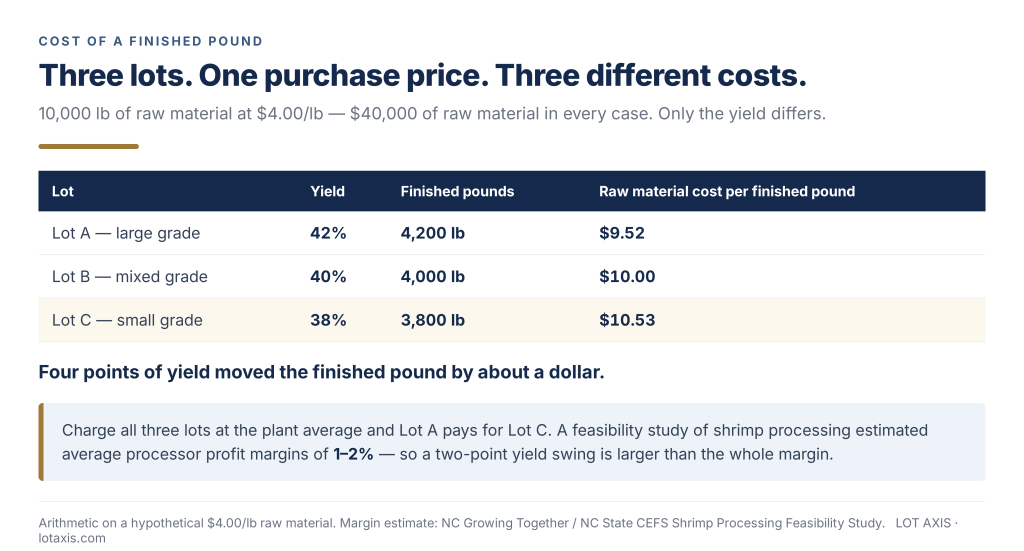
Run the arithmetic on a single purchase. Ten thousand pounds of raw material at $4.00 per pound is $40,000 either way. At a 42% yield it produces 4,200 pounds of finished product, a raw-material cost of $9.52 per finished pound. At 38% it produces 3,800 pounds at $10.53. Four points of yield moved the cost of the finished pound by about a dollar. If the two lots came from different suppliers, different size grades or different boats, the average yield tells you nothing about which one to buy again.
Scale that against the margins in the business. A North Carolina feasibility study of shrimp processing estimated average profit margins for shrimp processors in the range of 1–2% and modelled its own plant at a 15% target margin, with the amount of raw material to procure driven directly by the yield at each processing stage.[5] Against a one- or two-point margin, a two-point yield difference is not a rounding error. It is the business.
The peer-reviewed work points the same direction, and further. Researchers at the Technical University of Denmark tracked 60 individual Atlantic salmon through an industrial filleting line, recording weight at each step. Around 50% of the gutted weight was saleable fillet after deep skinning, with an average weight loss of 23.3% at filleting alone. They then built a partial least squares model from six pre-processing variables — weight, length, thickness across the dorsal fin and derived ratios — that predicted filleting yield well enough to “estimate the slaughter yield for a certain batch before ordering from the slaughterhouse,” so a processor can assign the right batch to the right product category.[6]
That is the whole argument in one sentence. Yield is a property of a specific lot of raw material, and it is knowable early enough to act on.
What “Yield by Lot” Actually Requires
It is less than people assume. Four habits:
- Weigh in, by lot. Every receipt gets a traceability lot code and a recorded weight on a stated basis. Not a carton count that assumes a nominal weight.
- Weigh out, by lot. Every production run records finished weight against the input lot or lots, on the same basis, at the same point in the process.
- Account for the rest of the fish. Frames, trim, skin and heads are not waste if you sell them, and they are not invisible if you do not. Recent work puts typical fillet yields for most species between 40% and 60%, with by-product volumes handled at industrial scale — one survey of processors found edible yield averaging 76% of production volume where heading-and-gutting was included, and rendering rates for the remainder ranging from 37% to 99%.[7][8] A lot-level yield record that ignores by-product streams understates the value you recovered.
- Attach a reason code when yield moves. Size grade, supplier, boat, holding time, machine, crew, product form. Without the reason, a variance report is a complaint; with it, it is a purchasing decision.
The Records the Rule Already Asks For
There is a quiet overlap here that most processors have not noticed.
Under the FDA Food Traceability Rule, transformation of a listed food requires records that include the traceability lot code of each input, the new traceability lot code assigned to the output, the location, the date, the product description — and the quantity and unit of measure of both the food used and the food produced.[9] Traceability lot codes are assigned at transformation, not invented at shipping.[10] Records must be retained and made available to FDA within 24 hours of a request.[11][12] Most finfish, crustaceans and molluscan shellfish sit on the Food Traceability List, so seafood processors are in scope.[13]
Read that requirement list again as an operations person rather than a compliance officer. Input lot, output lot, quantity in, quantity out, on a date, at a location. That is yield. The rule asks you to record the numerator and the denominator, and to link them to the specific lots involved. A plant that captures transformation KDEs properly is one report away from lot-level yield — and a plant that runs on average yields is usually the same plant that cannot reconstruct an input-to-output link in 24 hours.
What Changes on Monday
When yield is measured lot by lot, three conversations change immediately. Purchasing stops comparing suppliers on landed price alone and starts comparing them on cost per finished pound, which is the only price that pays wages. Production gets an early-warning signal: a run trending two points below the lot’s expected yield is a machine, a crew or a raw-material problem happening now, not a surprise at month end. And quoting gets honest, because the yield in the quote is the yield your own lots actually delivered, from your own plant, this season — not a book value from a study of six fish.
How Lot Axis Fits
Lot Axis is built for lot-controlled processing: barcode-driven receiving, production and shipping that keep one current record of every lot from the dock through transformation to the customer. Because input weights and output weights are captured against the traceability lot code as the work happens, yield by lot is not a separate reporting project — it falls out of the same scans that produce your traceability records. Supervisors see it while the lot is still on the floor. That is what we mean by Lot Intelligence™: compliance data used every day as operating information.
If you are carrying one yield number for a product that arrives in a dozen different grades, you are not costing your production. You are averaging it.
Want to see yield by lot on your own product flow? Schedule a Lot Axis demonstration and we will walk one receipt through production and out the door, with the weights attached.
This article is general information about food processing operations and a federal recordkeeping regulation, not legal or accounting advice. Confirm your obligations against the current text of 21 CFR part 1, subpart S. Regulatory status described is as of September 16, 2026.
Sources
Paste this list at the end of the published post. Keep it to 6–8 authoritative links — primary law, agency pages, standards bodies and peer-reviewed work. The full research package below stays internal.
- FAO — Yield and Nutritional Value of the Commercially More Important Fish Species (Part 1: Introduction and Tables)
https://www.fao.org/4/T0219E/T0219E01.htm
- FAO — Yield and Nutritional Value of the Commercially More Important Fish Species (Part 3: Monographs, species yield tables)
https://www.fao.org/4/T0219E/T0219E03.htm
- Alaska Sea Grant — Recoveries and Yields from Pacific Fish and Shellfish (MAB-37, revised 2004; free PDF)
https://seagrant.uaf.edu/bookstore/pubs/MAB-37.html
- Seafish — Fish and shellfish yields table
https://training.seafish.co.uk/wp-content/uploads/2024/05/Yields-page.pdf
- Johansson, Guðjónsdóttir, Nielsen, Skytte and Frosch — Analysis of the Production of Salmon Fillet: Prediction of Production Yield, Journal of Food Engineering 204 (2017) 80–87
https://doi.org/10.1016/j.jfoodeng.2017.02.022
- NC Growing Together / NC State Center for Environmental Farming Systems — Shrimp Processing Feasibility Study
https://www.cefs.ncsu.edu/ncgt/NCGT-Shrimp-Processing-Feasibility-Study_FINAL.pdf
- 21 CFR 1.1350 — Records required when transforming a food on the Food Traceability List
https://www.law.cornell.edu/cfr/text/21/1.1350
- FDA — FSMA Final Rule on Requirements for Additional Traceability Records for Certain Foods
https://www.fda.gov/food/food-safety-modernization-act-fsma/fsma-final-rule-requirements-additional-traceability-records-certain-foods